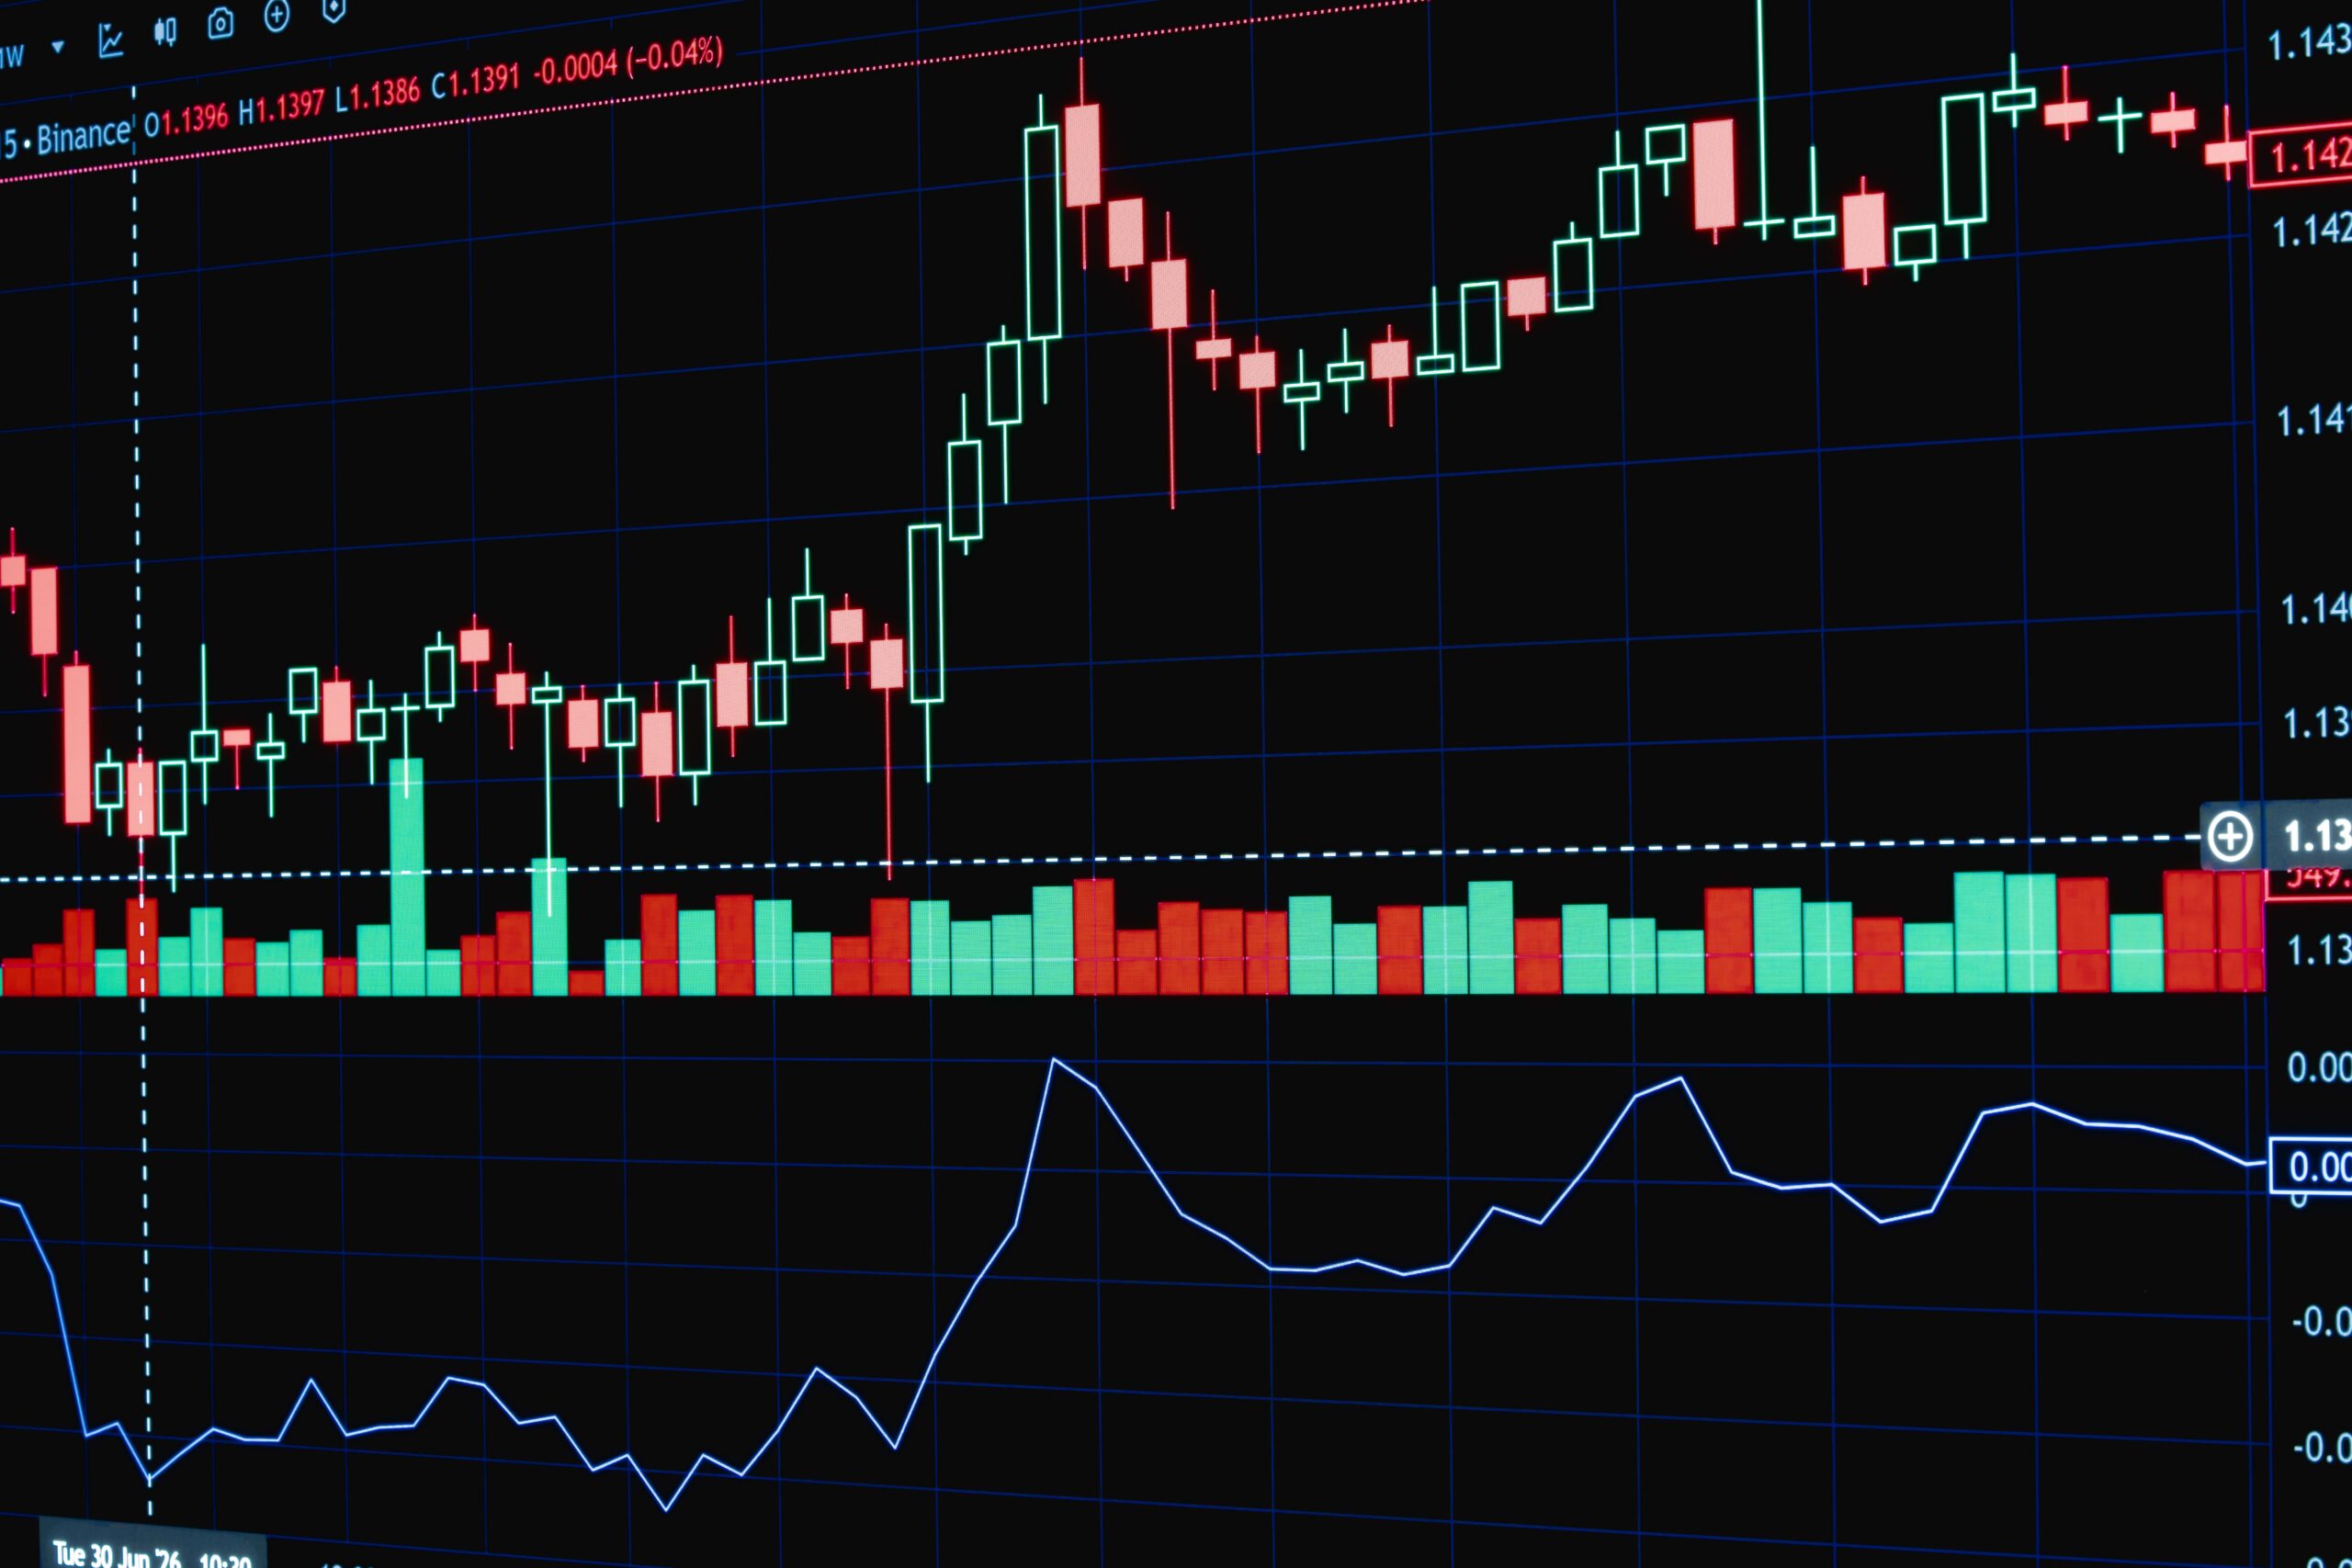
Most beginners stare at naked charts and see pure chaos. They see random red and green bars moving with a vicious unpredictability that vaporizes trading accounts in hours. I know that feeling intimately. Over a decade ago, I sat in front of a glowing monitor at 2 AM, desperately trying to decode a plummeting EUR/USD chart while my pulse hammered in my ears.
That anxiety only began to fade when I stopped relying on lagging, colorful indicators and finally learned to speak the market’s native language. Price action is not some mystical secret reserved for Wall Street elites. It is simply the psychological footprint of millions of buyers and sellers battling it out in real-time. Once you learn to read these footprints, the noise fades away. You stop guessing. You start anticipating. Let me walk you through the exact five signals that fundamentally changed how I pull profits from the market.
The Illusion of Complex Systems
New traders almost always fall into the trap of overcomplicating their screens. They layer moving averages over MACD, throw in some RSI, and sprinkle Fibonacci retracements on top until the actual price is barely visible. I spent my first two years stuck in this exact indicator matrix. My charts looked like a laser light show, yet my trading account kept bleeding. Indicators merely summarize past data. They tell you what happened yesterday, not what is happening right now.
Stripping my charts down to bare candlesticks was terrifying at first, but it forced me to confront reality. Price is the only leading indicator that matters. Every candlestick tells a story of aggression, surrender, or indecision between bulls and bears. When you isolate these movements, specific recurring patterns emerge. These patterns offer highly probable clues about where the institutional money is flowing.
Pin Bar (Reversal Signal)
Nothing screams market rejection quite like a Pin Bar. Picture a candlestick with a small body and a long, protruding tail that sticks out wildly from the surrounding price action. That long wick is the visual representation of a trap. It shows us exactly where the market tried to push lower or higher, only to be aggressively beaten back by the opposing side in the same time frame. I love trading Pin Bars because they provide an immediate, visually obvious line in the sand for placing a tight stop loss.
However, a Pin Bar floating in the middle of nowhere is practically useless. You need context. The most profitable Pin Bars I trade are those that form directly on major structural levels, like a daily support zone or a significant moving average. When price drives down into a heavily defended support area and immediately snaps back to leave a long lower wick, it proves the buyers are waiting. That is your cue to ride the reversal. Look for the tail to be at least two-thirds of the entire candle length to ensure the rejection is genuine.
Inside Bar (Breakout Play)
While the Pin Bar represents violent rejection, the Inside Bar signals explosive potential born from market compression. An Inside Bar occurs when an entire candlestick highs and lows included fits completely within the range of the preceding “mother bar.” Think of it as a coiled spring. The market is taking a breath. Buyers and sellers are at a temporary standstill, tightly compressing the price action into a narrow box.
I trade Inside Bars primarily as continuation signals during strong, established trends. If an asset is aggressively climbing and suddenly prints a tight Inside Bar, I prepare for a breakout. The smart money is simply absorbing profit-taking before launching the next leg up. You place your entry order just past the high or low of the mother bar, and let the sudden release of built up pressure trigger you into a high momentum trade. It requires patience, but the risk to reward ratio on these setups is consistently phenomenal.
Engulfing Bar (Momentum Shift)
If you want to see exactly when control of the market violently changes hands, look for an Engulfing Bar. This two-candle pattern is ruthless. It happens when a smaller candle is immediately followed by a much larger candle of the opposite color, completely shadowing or engulfing the previous one’s body. A bullish engulfing pattern at the bottom of a downtrend tells you that buyers just stepped in and completely overwhelmed the sellers in a single session.
Over my years of live trading, I have found that the size of the engulfing candle dictates the reliability of the signal. If the second candle closes well above the high of the previous three or four candles, the momentum shift is undeniable. It is a dominant display of institutional force. I immediately start looking for an entry on the next candle’s open, tucking my stop loss safely beneath the low of the engulfing bar. When the big players show their hand this clearly, you do not argue with them. You simply follow their wake.
Support & Resistance Test
Candlestick shapes are great, but they mean absolutely nothing if you ignore the battlegrounds where they form. Support and resistance zones are the floors and ceilings of the market. They are psychological price points where historical buying and selling pressure previously flipped the trend. A true price action trader spends 80% of their time simply marking these zones on higher timeframes and waiting patiently for the price to revisit them.
The magic happens during the test. When price approaches a major resistance level, I do not blindly sell in anticipation. I watch the candlesticks closely to see how the market reacts to the ceiling. Does the momentum slow down? Do we see small bodies and long upper wicks indicating exhaustion? A successful Support & Resistance Test confirms that the historical barrier is still holding fast. Trading these tests offers an incredibly asymmetric risk profile because your invalidation point is crystal clear. If a support level breaks and closes below, you accept the loss and exit the trade immediately.
Higher Lows & Lower Highs
Most beginners obsess over finding the exact top or bottom of a market. That is a fantastic way to go broke quickly. The real money is made in the meaty middle of a trend, and to catch that, you must master the concept of Higher Lows and Lower Highs. This is the structural DNA of any trending asset. An uptrend is never a straight vertical line. It moves like a staircase. Price pushes up, pulls back to form a Higher Low, and then breaks out higher again.
I use this simple structural read as my ultimate compass on the charts. As long as the market continues printing Higher Lows, I strictly look for buying opportunities. The moment price fails to make a new high and subsequently prints a Lower High, my internal alarm bells ring. That failure breaks the rhythm. It whispers that the buyers are losing their grip. By purely reading this swing structure, you naturally keep yourself aligned with the dominant momentum and avoid fighting a losing battle against the broader market current.
The Critical Element of Context
Memorizing these five signals is just the beginning of your journey. The harsh truth is that a pattern is only as strong as the context surrounding it. You can spot a textbook bullish engulfing bar on a 15-minute chart, but if it prints right under a massive daily resistance zone, you are walking straight into a slaughterhouse. Market structure always trumps individual candlestick patterns.
I tell every trader I mentor to start their day on the daily and weekly charts. Map the macro environment first. Are we in a deep recessionary downtrend or a screaming bull market? Once you establish that overarching narrative, drop down to the lower timeframes to hunt for the specific price action signals we just discussed. A Pin Bar aligning perfectly with a broader structural trend is a beautiful, high-probability weapon. A random pattern in a choppy, directionless market is nothing more than a coin flip.
Your Next Steps on the Charts
Transitioning to pure price action trading requires a massive shift in mindset. You are essentially taking off the training wheels and learning to feel the heartbeat of the market on your own. There will be days when the market fakes you out, hits your stop loss, and immediately runs in your predicted direction. That is just the cost of doing business. The goal is not perfection. The goal is building a sustainable statistical edge.
Focus on mastering just one of these setups before moving on to the next. Spend the next week watching your charts and hunting exclusively for pristine Inside Bars. See how they behave. Watch where they fail. I would love to hear which of these signals makes the most intuitive sense to you right now. Have you already tried spotting these in real-time, or are you still trying to detach from your indicator setup? Drop your thoughts below, let’s talk about it.